How to Make BUSY Bar Widgets Without Coding

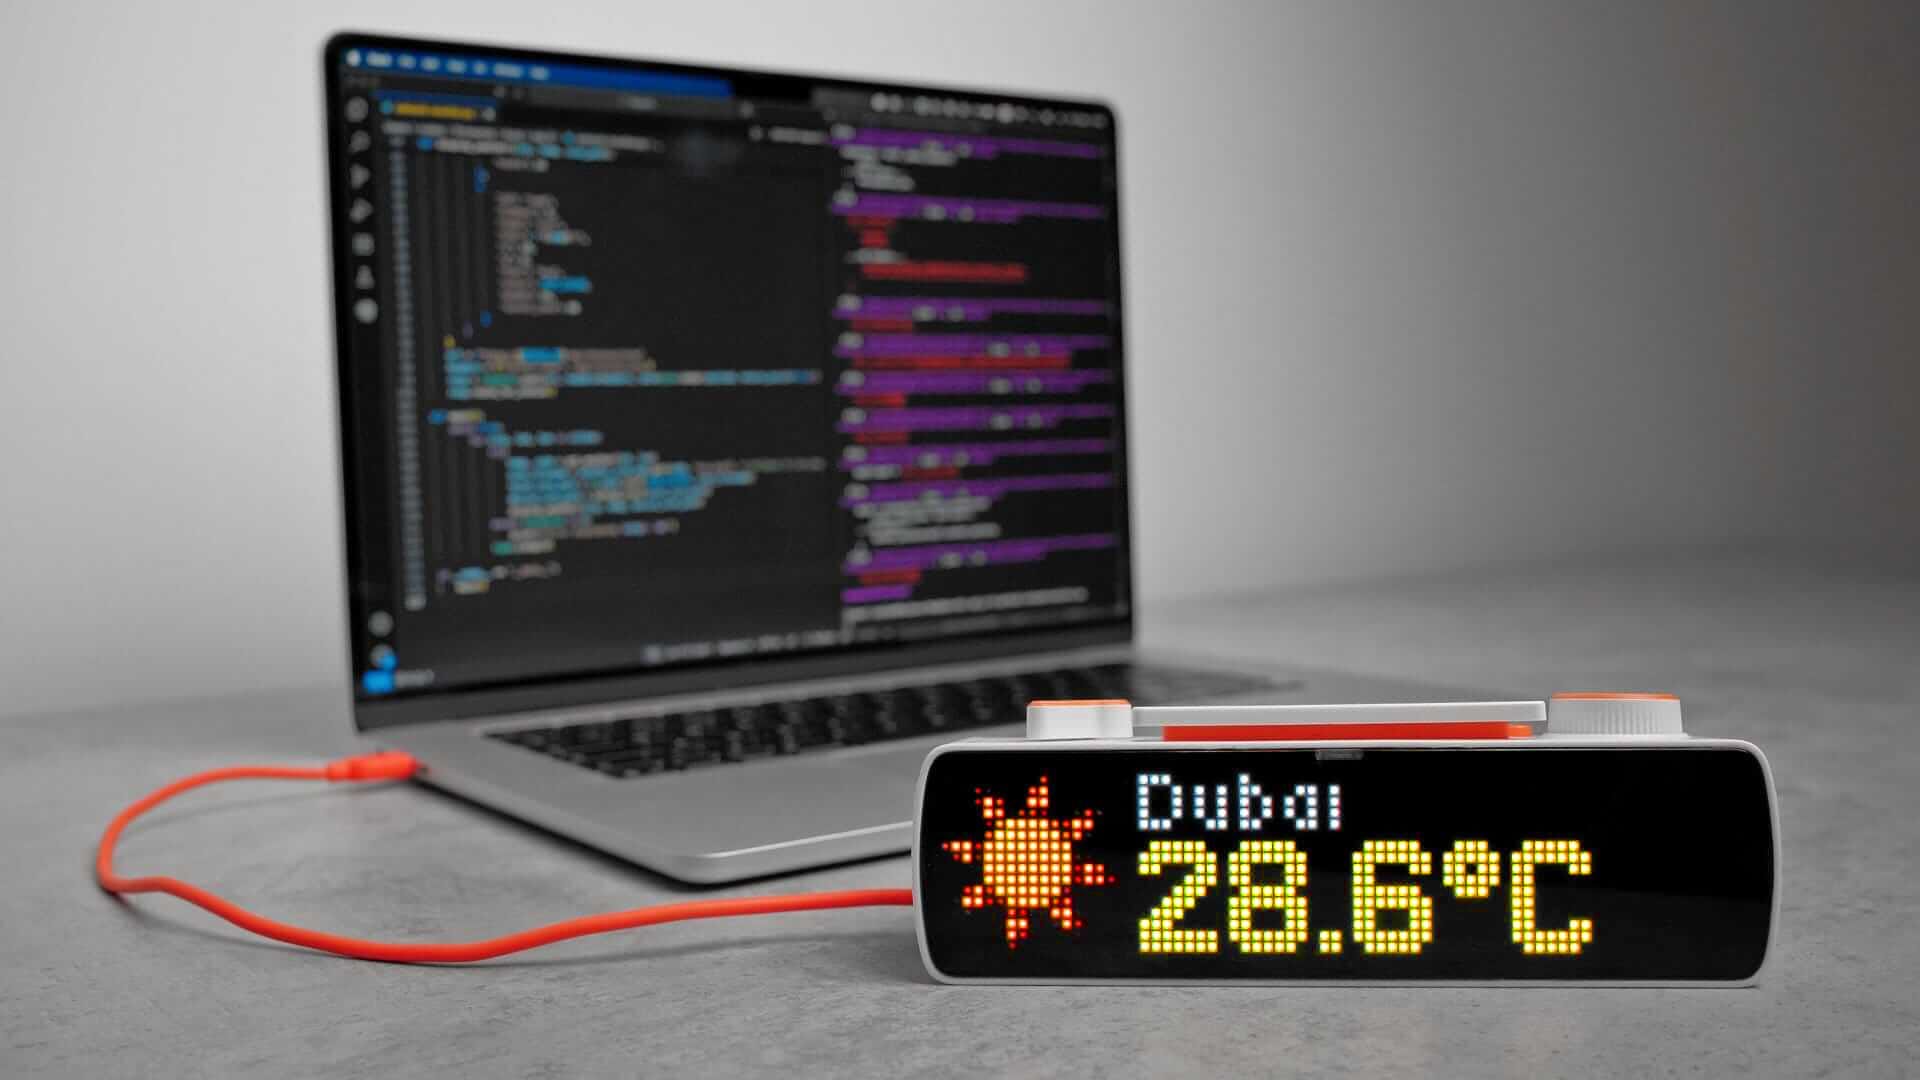
BUSY Bar is an advanced focus timer with distraction-blocking features and smart home integration. In this post, we’ll show how to create practical widgets for it. It’s not just for developers: anyone can do it.
Here you’ll learn how to:
- Display images and text on the BUSY Bar screen.
- Interact with BUSY Bar from your browser.
- Create widgets without coding.
All these interactions with BUSY Bar can be made via its open HTTP API — let's learn what it is.
One API for all connection types
The HTTP API is a universal protocol for controlling BUSY Bar across all three supported connection types:
- USB Ethernet — when you connect BUSY Bar to a PC, it appears as a network adapter with a virtual network.
- Wi-Fi LAN — a fast, wireless connection. BUSY Bar can be placed anywhere within Wi-Fi range.
- Cloud server — remote control over the internet with encryption and key-based authorization, using an API token issued in your BUSY Account.
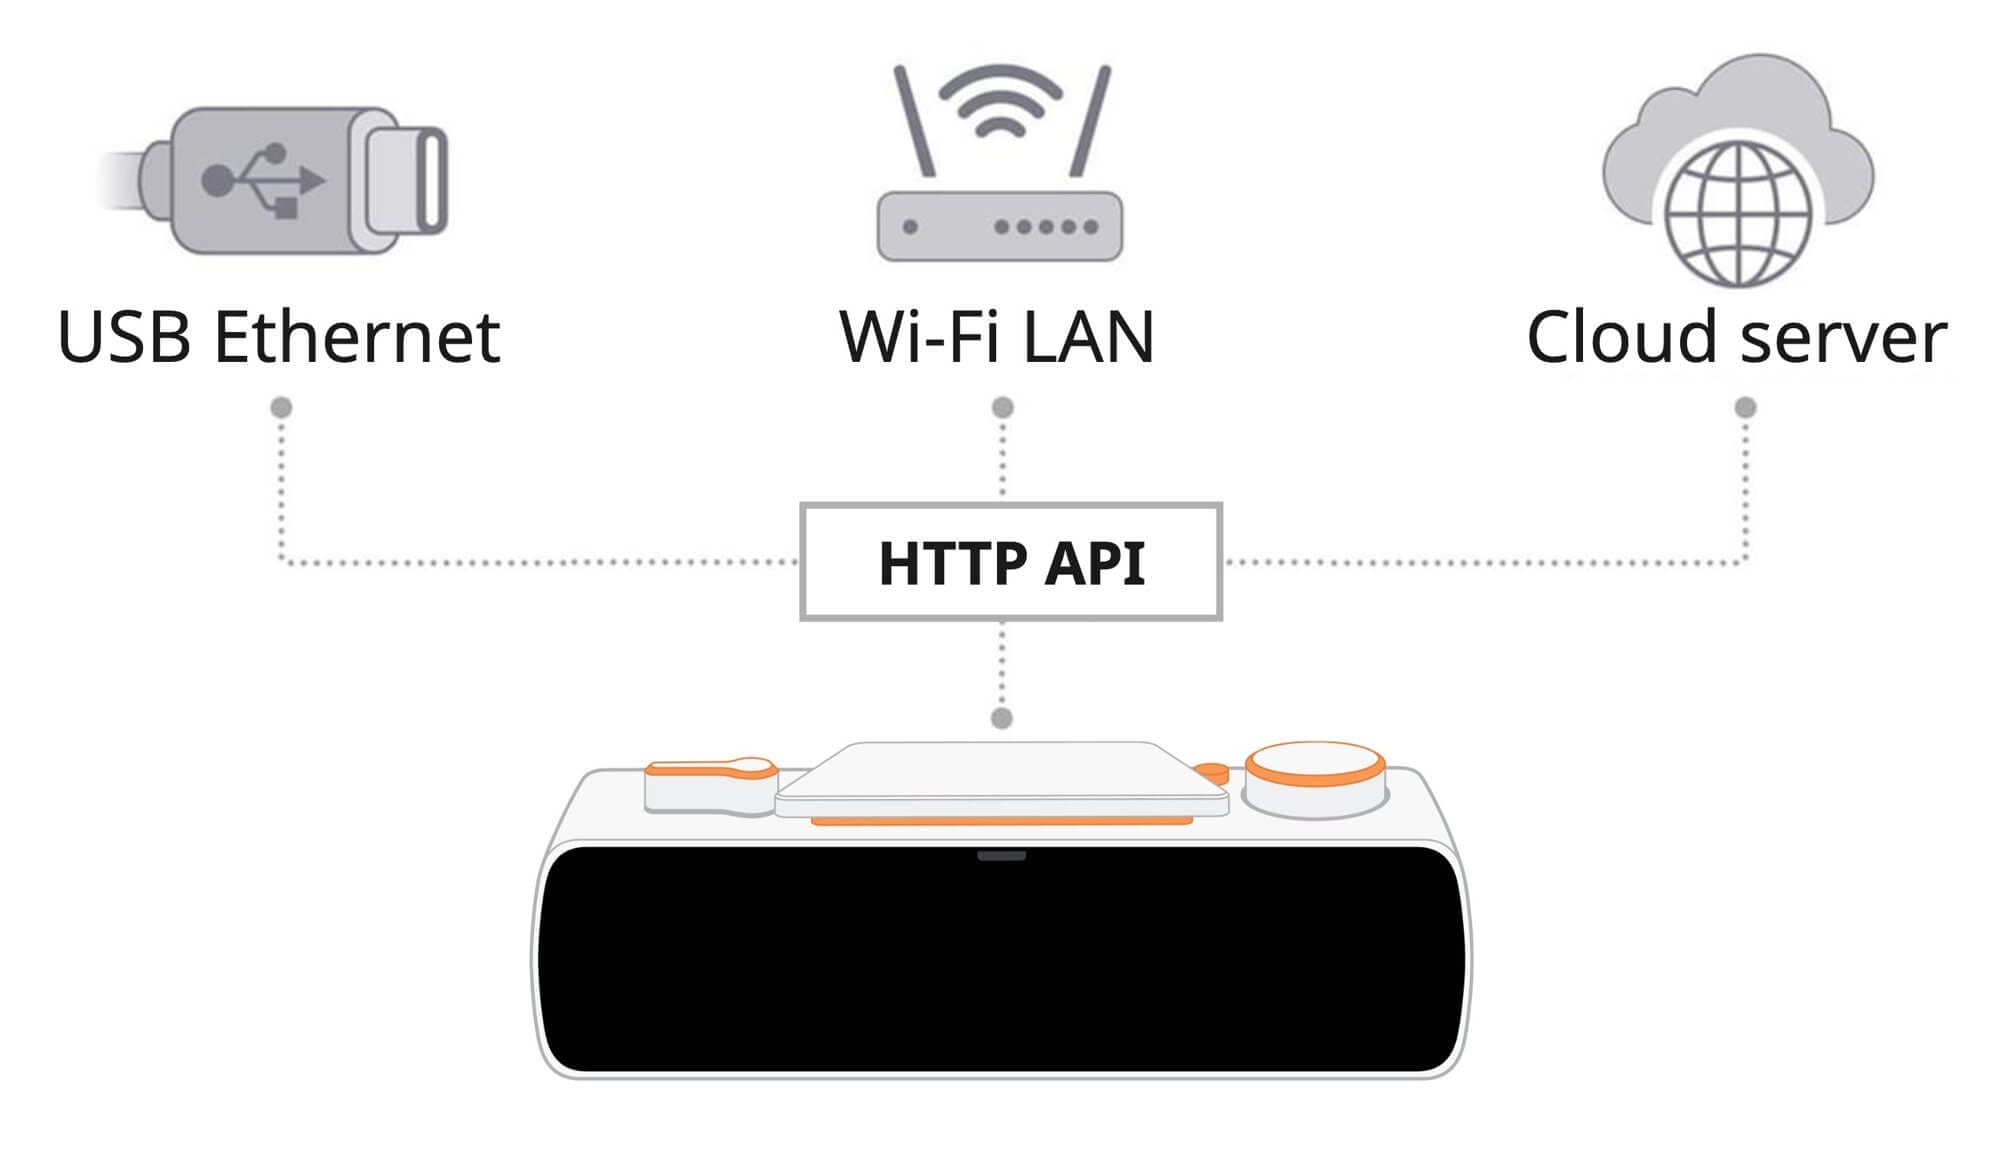
Since the same HTTP API works for all three connection types, you don't need to rewrite your code when switching between them.
How HTTP API works
As the name suggests, HTTP API is based on the HTTP protocol. It's used on the web to send data between browsers and web servers. When you enter a website URL, your browser sends an HTTP request and the server returns the web page in response.
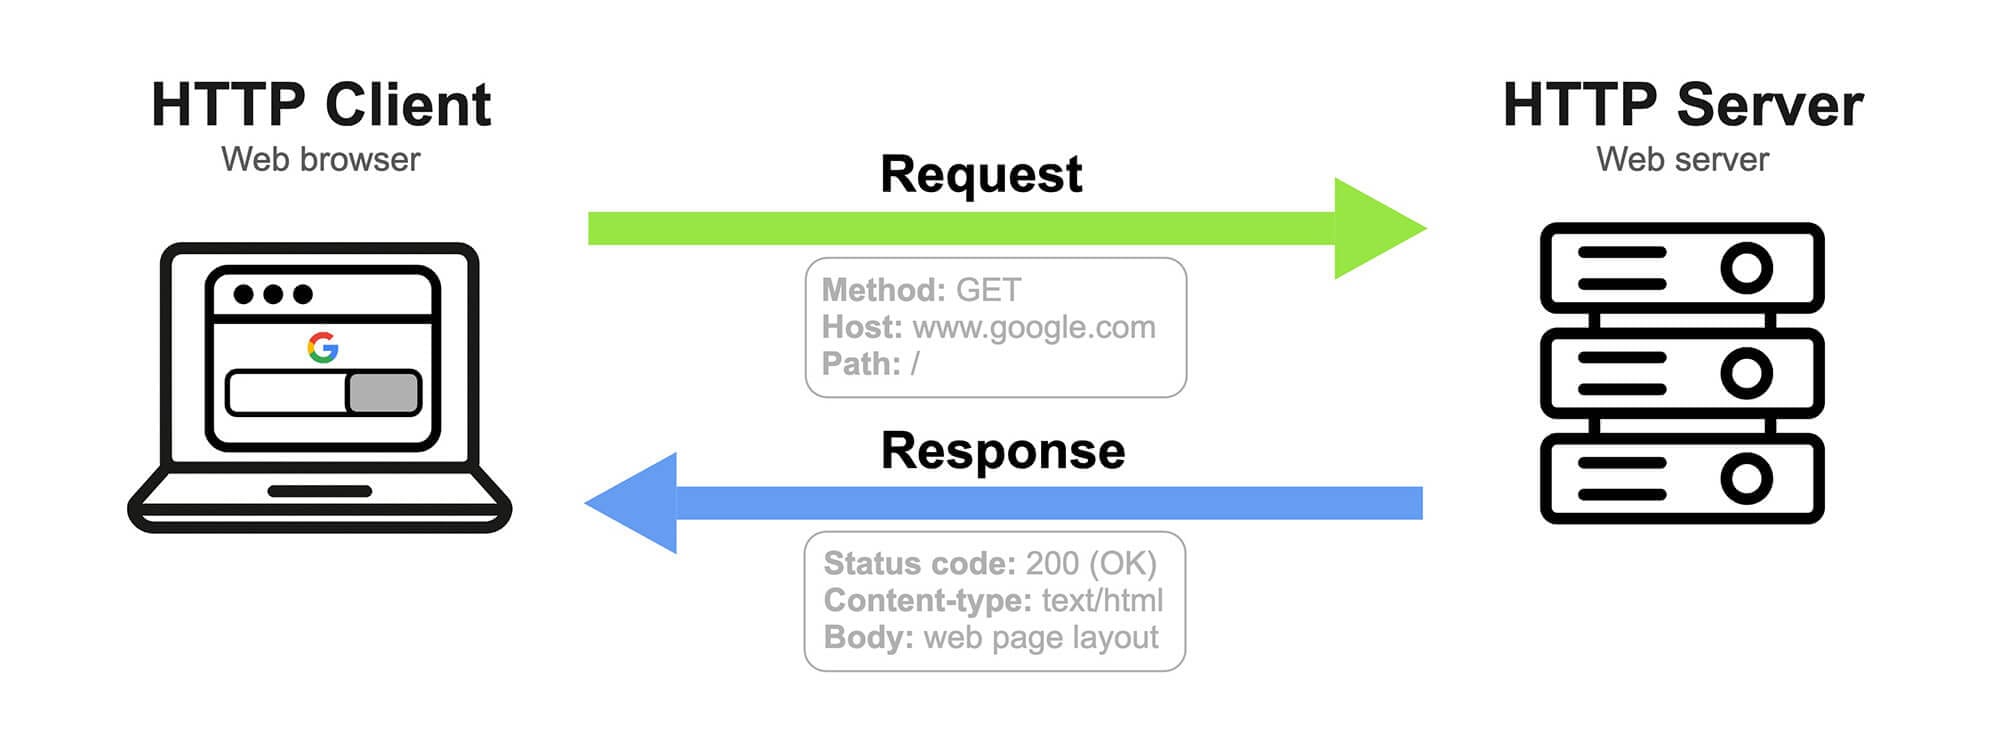
Communication with BUSY Bar works similarly, with it acting as an HTTP server, waiting for requests. Software on a PC acts as the HTTP client. This software can be any program that can send HTTP requests — for example, a smart home system, app, or script.
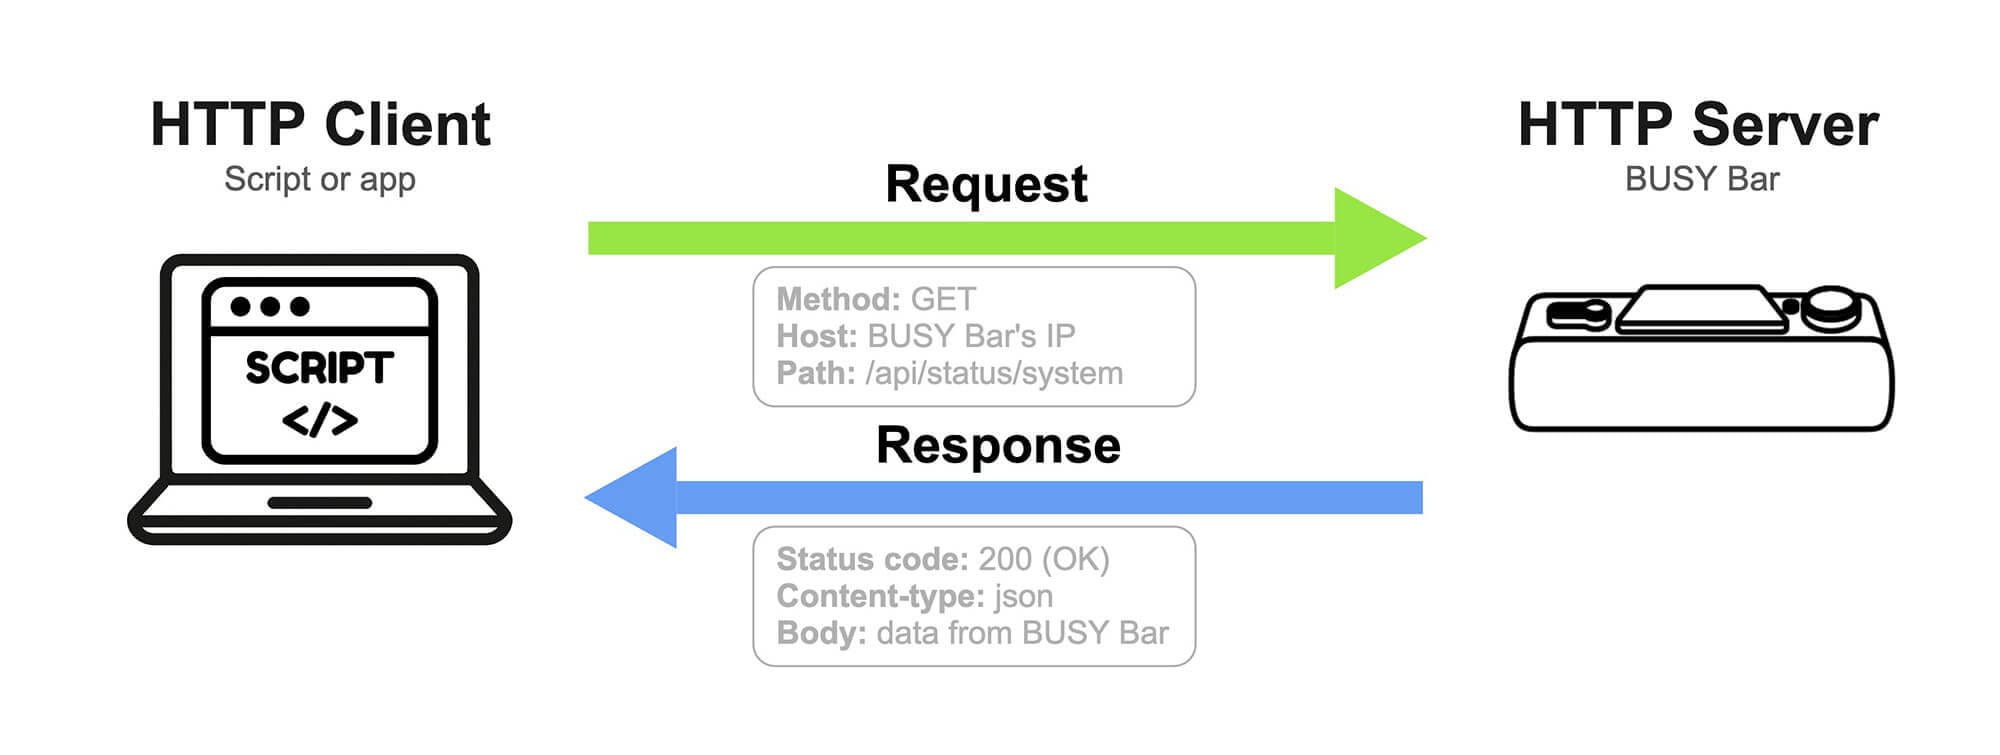
Thanks to the wide support of HTTP in programming languages, it’s possible to communicate with BUSY Bar using just a few lines of code. Some simple requests, like getting general information about BUSY Bar, can be sent directly through the browser — just go to http://10.0.4.20/api/status/system.
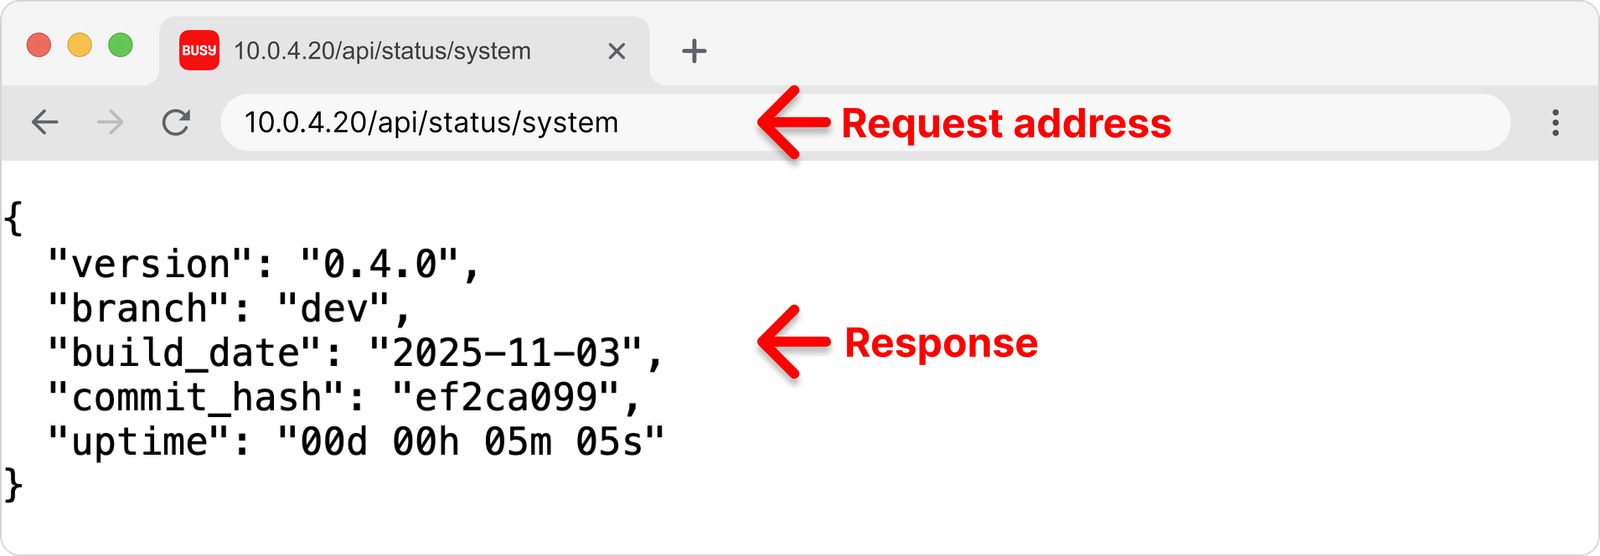
10.0.4.20 — it's even printed on its back cover. If using a Wi-Fi connection, the IP address is assigned by the router. In the following examples, we will use a USB connection.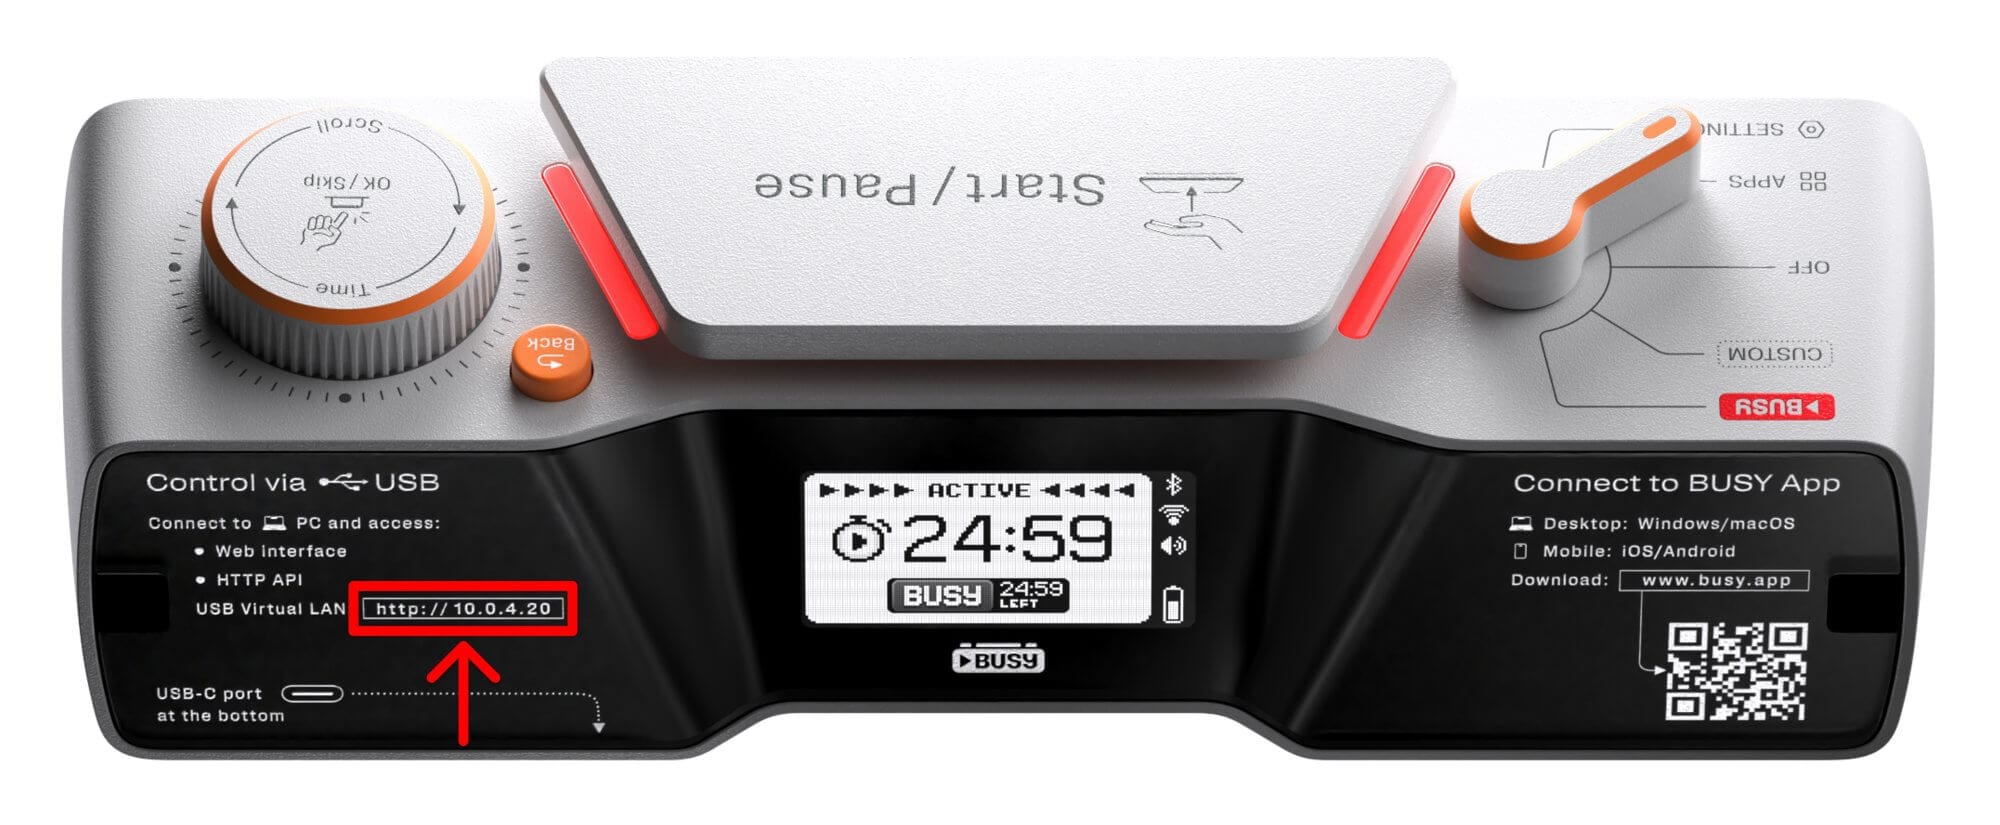
On-Device HTTP API docs
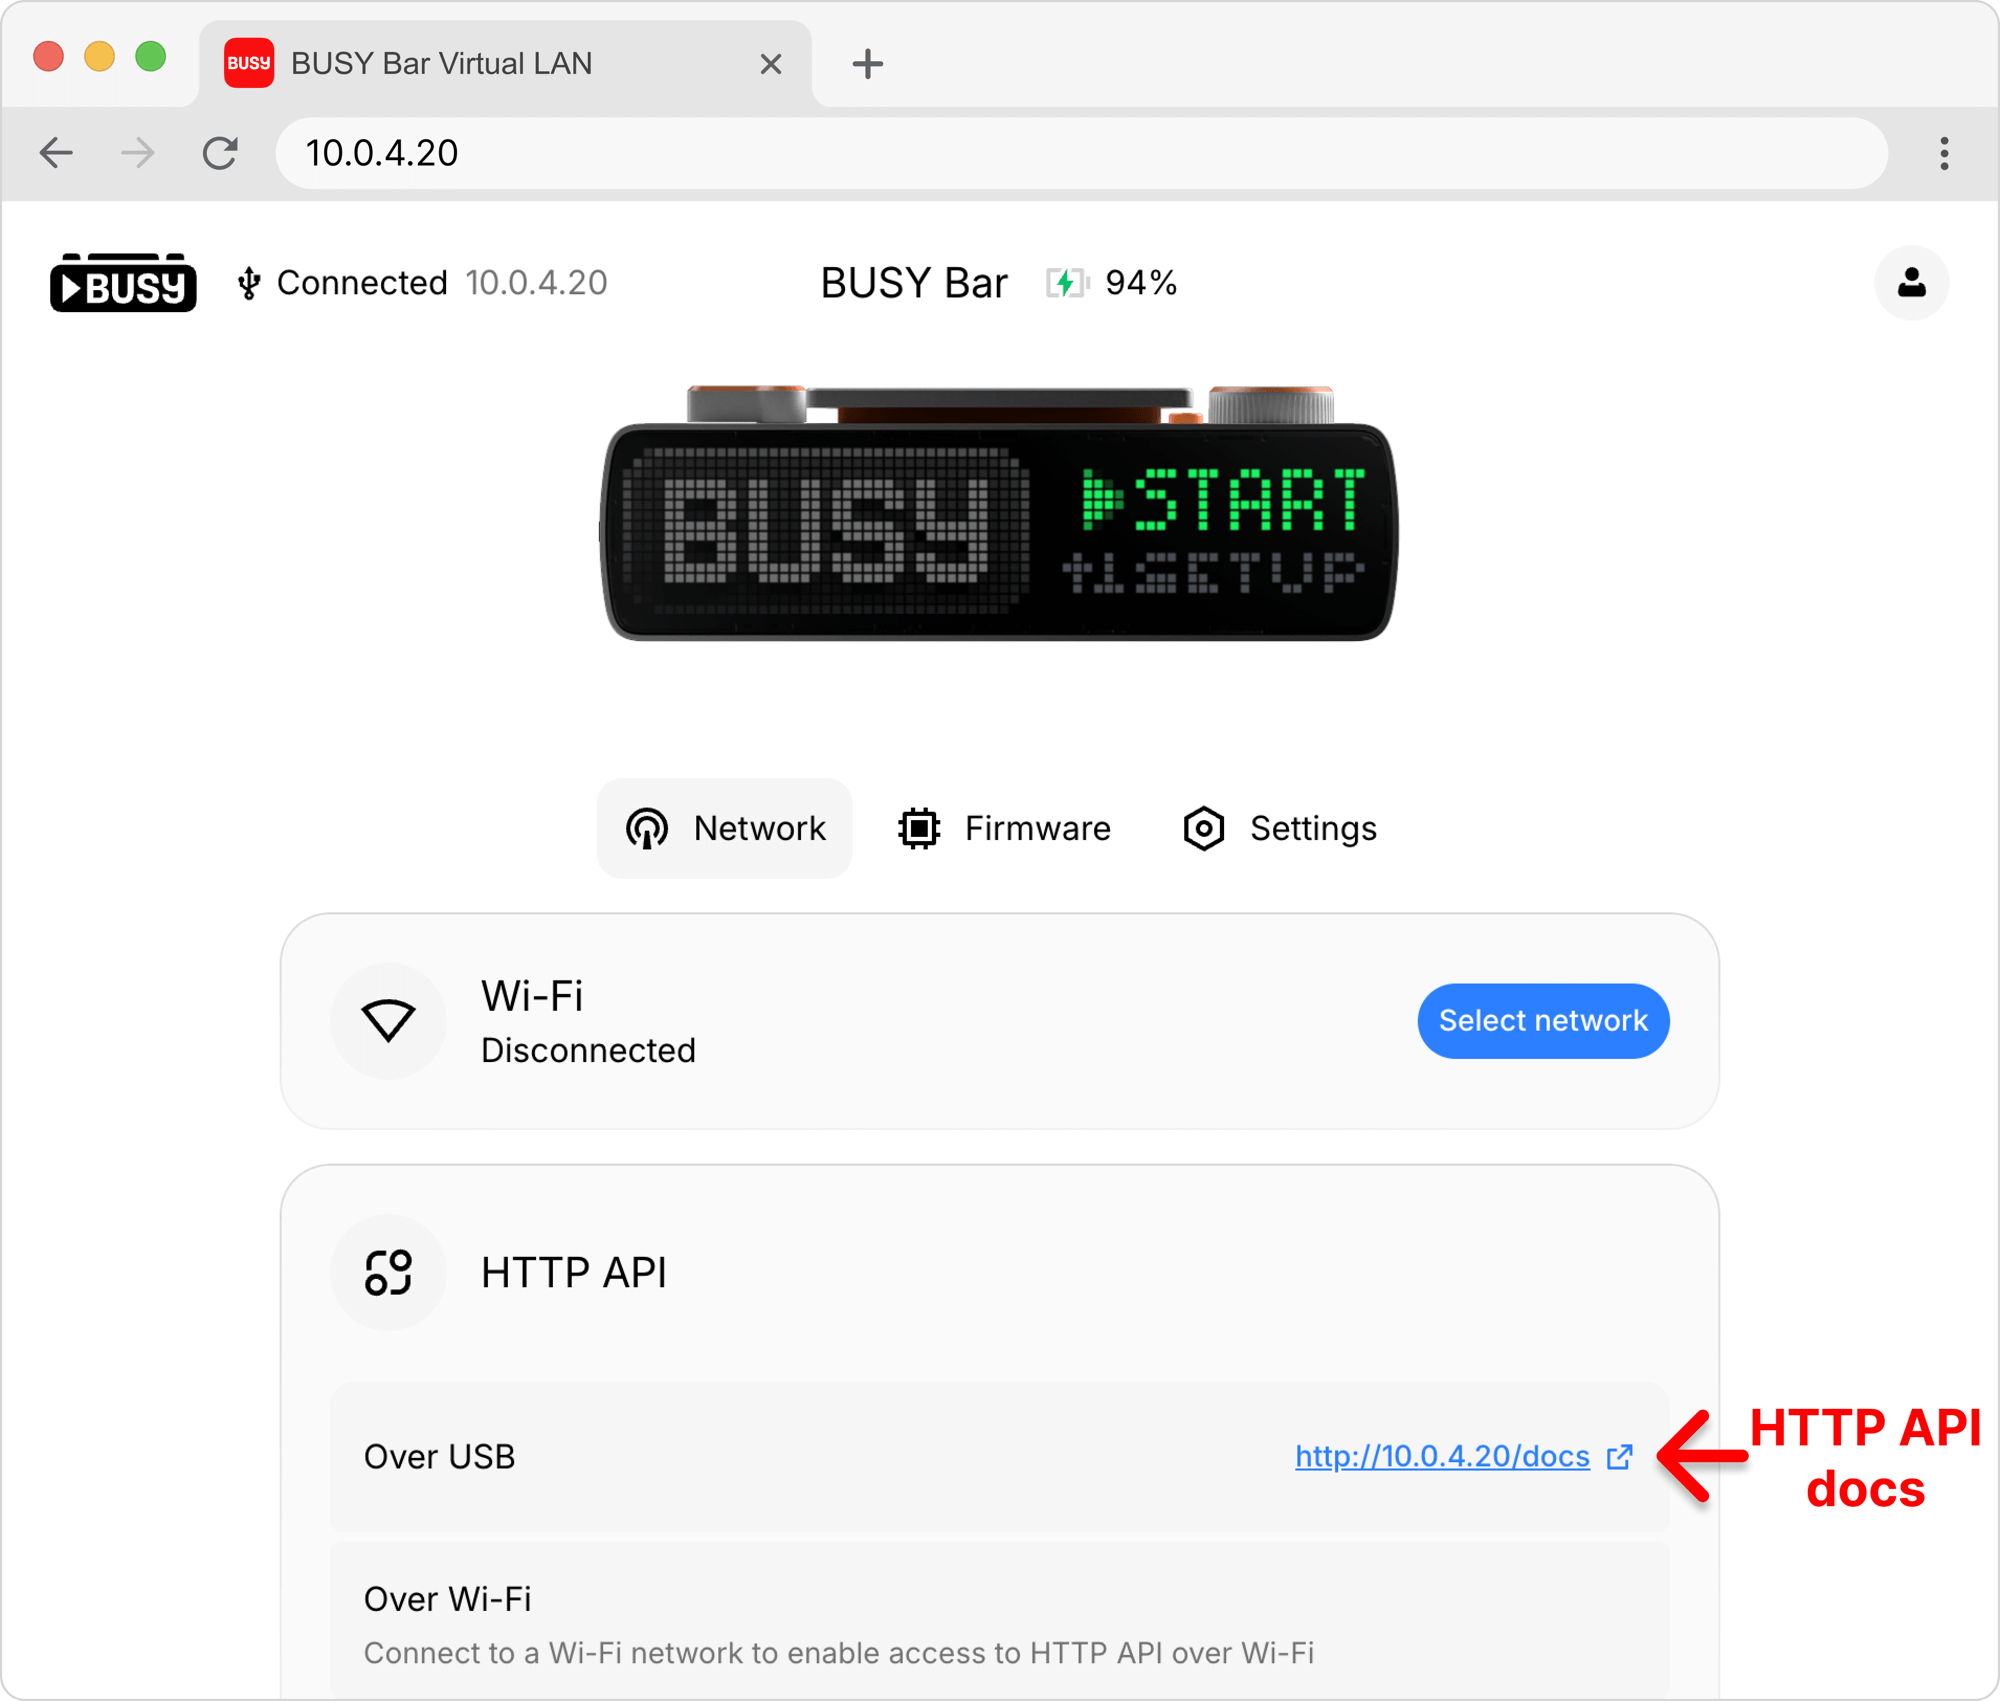
All supported HTTP requests, their parameters, and response formats are described in the documentation, which is stored directly on BUSY Bar. To access it, connect BUSY Bar to your PC via USB and go to http://10.0.4.20/docs.
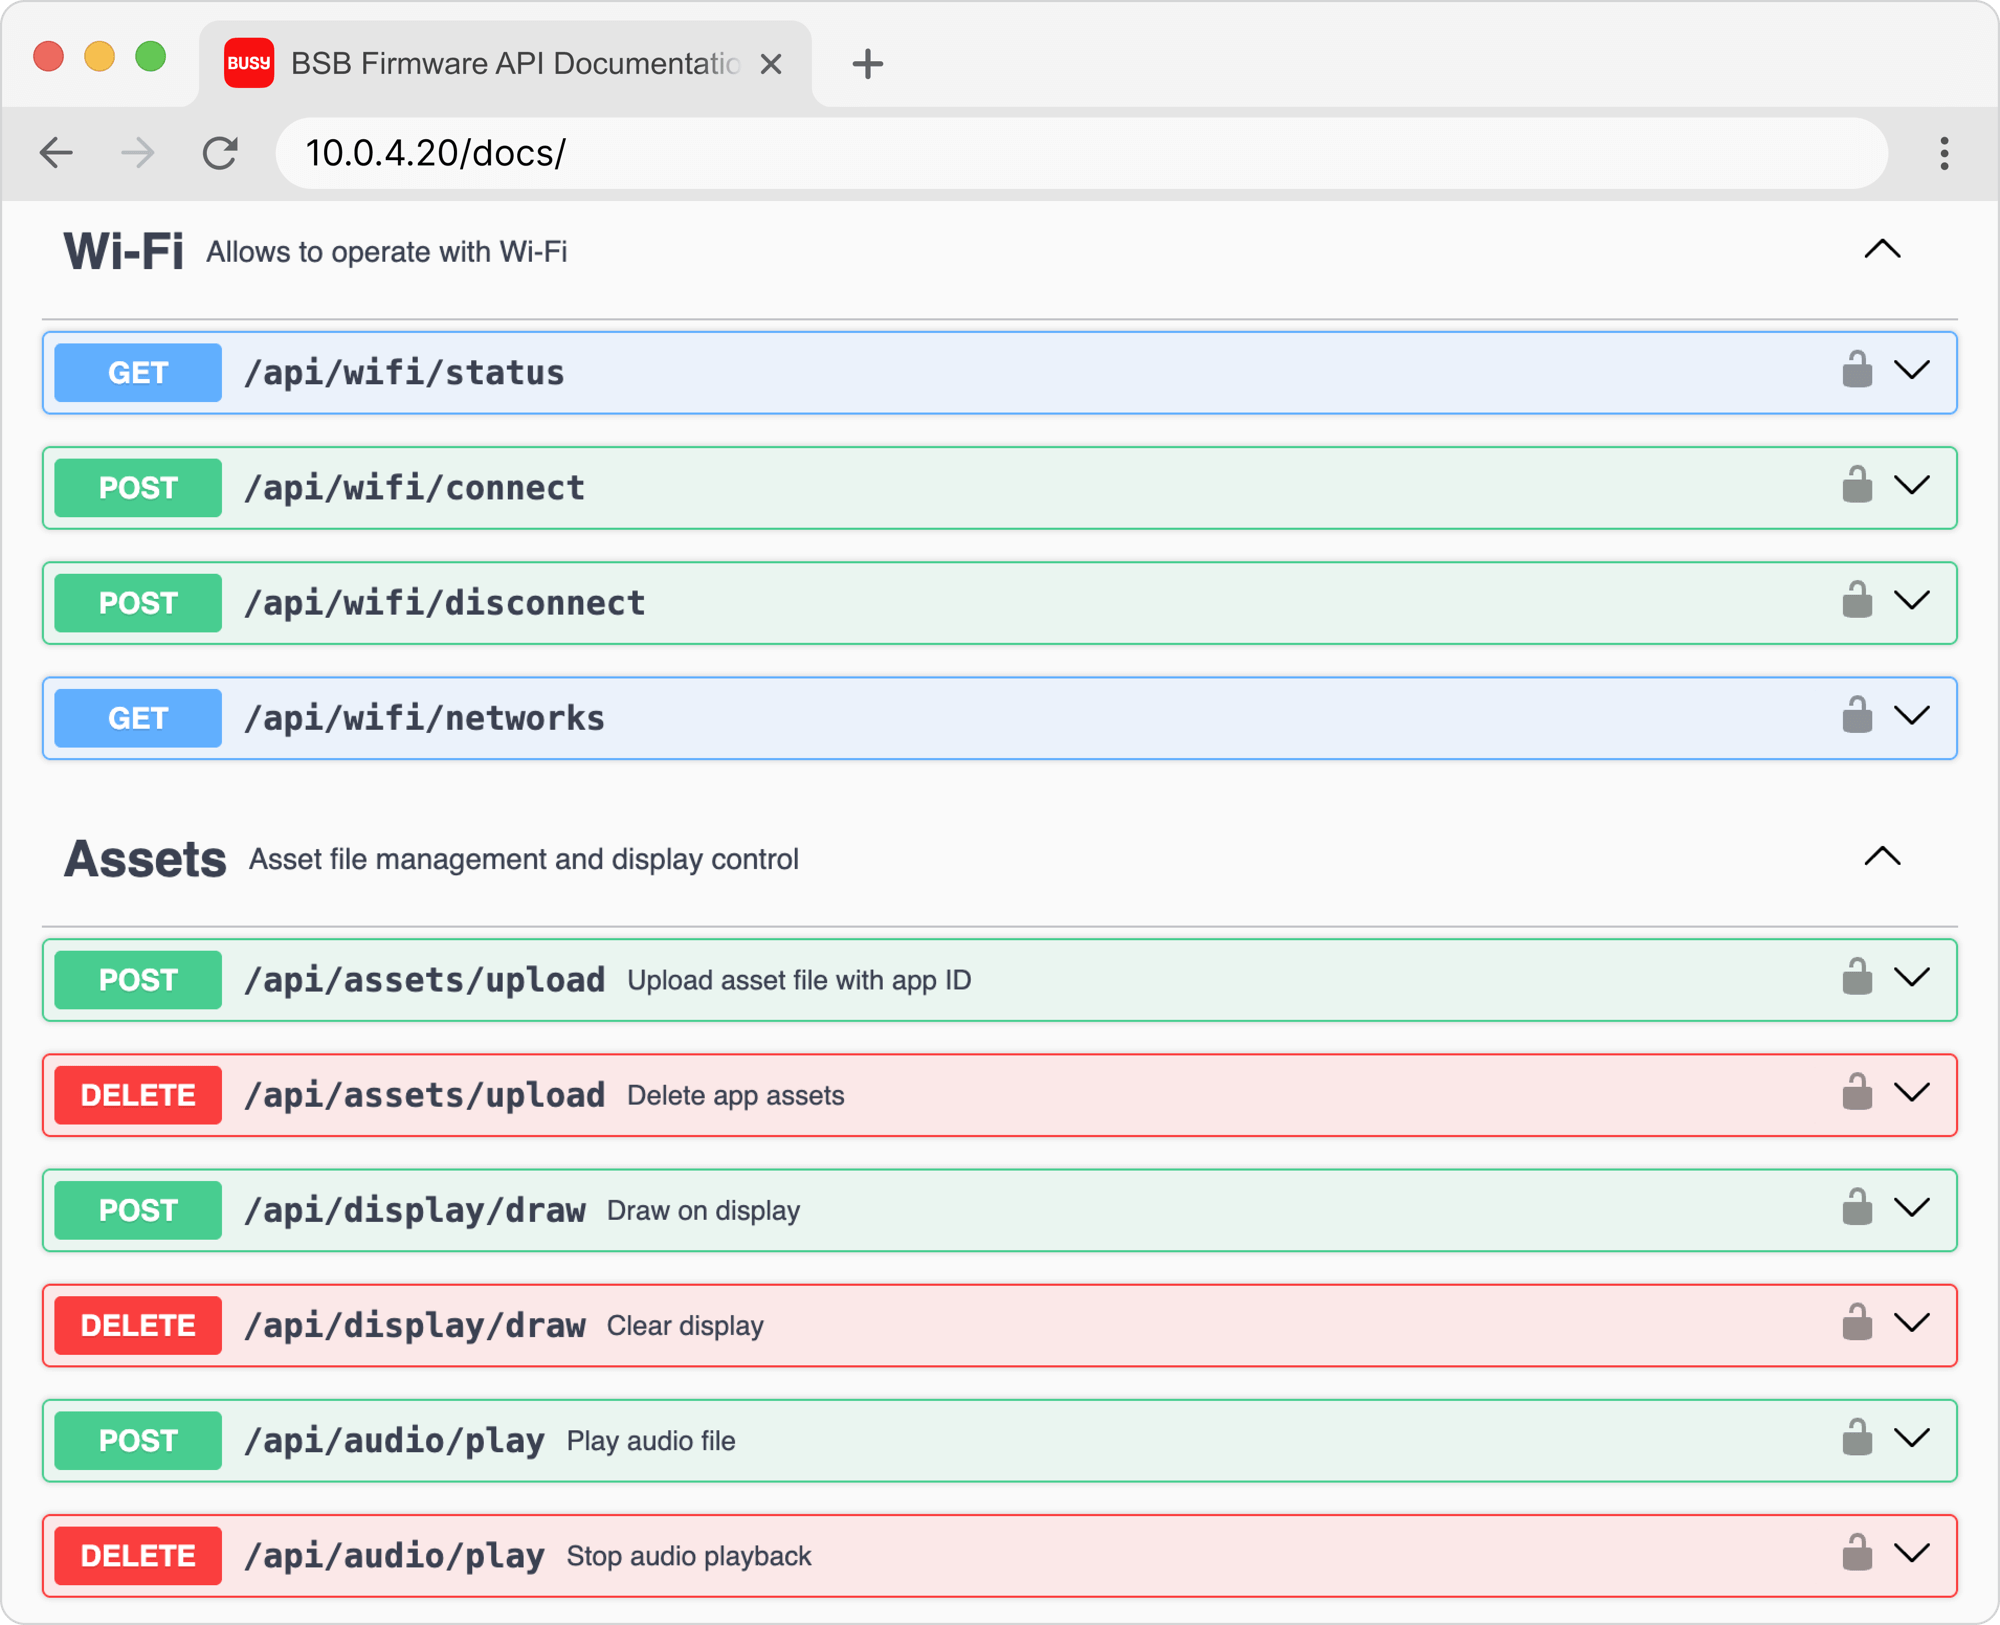
The HTTP API docs are also accessible from the BUSY Bar web interface home page, which is located at http://10.0.4.20.
You can test HTTP requests directly on the documentation page by doing the following:
- Choose a request, for example:
/api/display/draw(for displaying text and images on the BUSY Bar screen). - Click Try it out.
- Edit the request parameters.
- Click Execute to send the request to BUSY Bar.
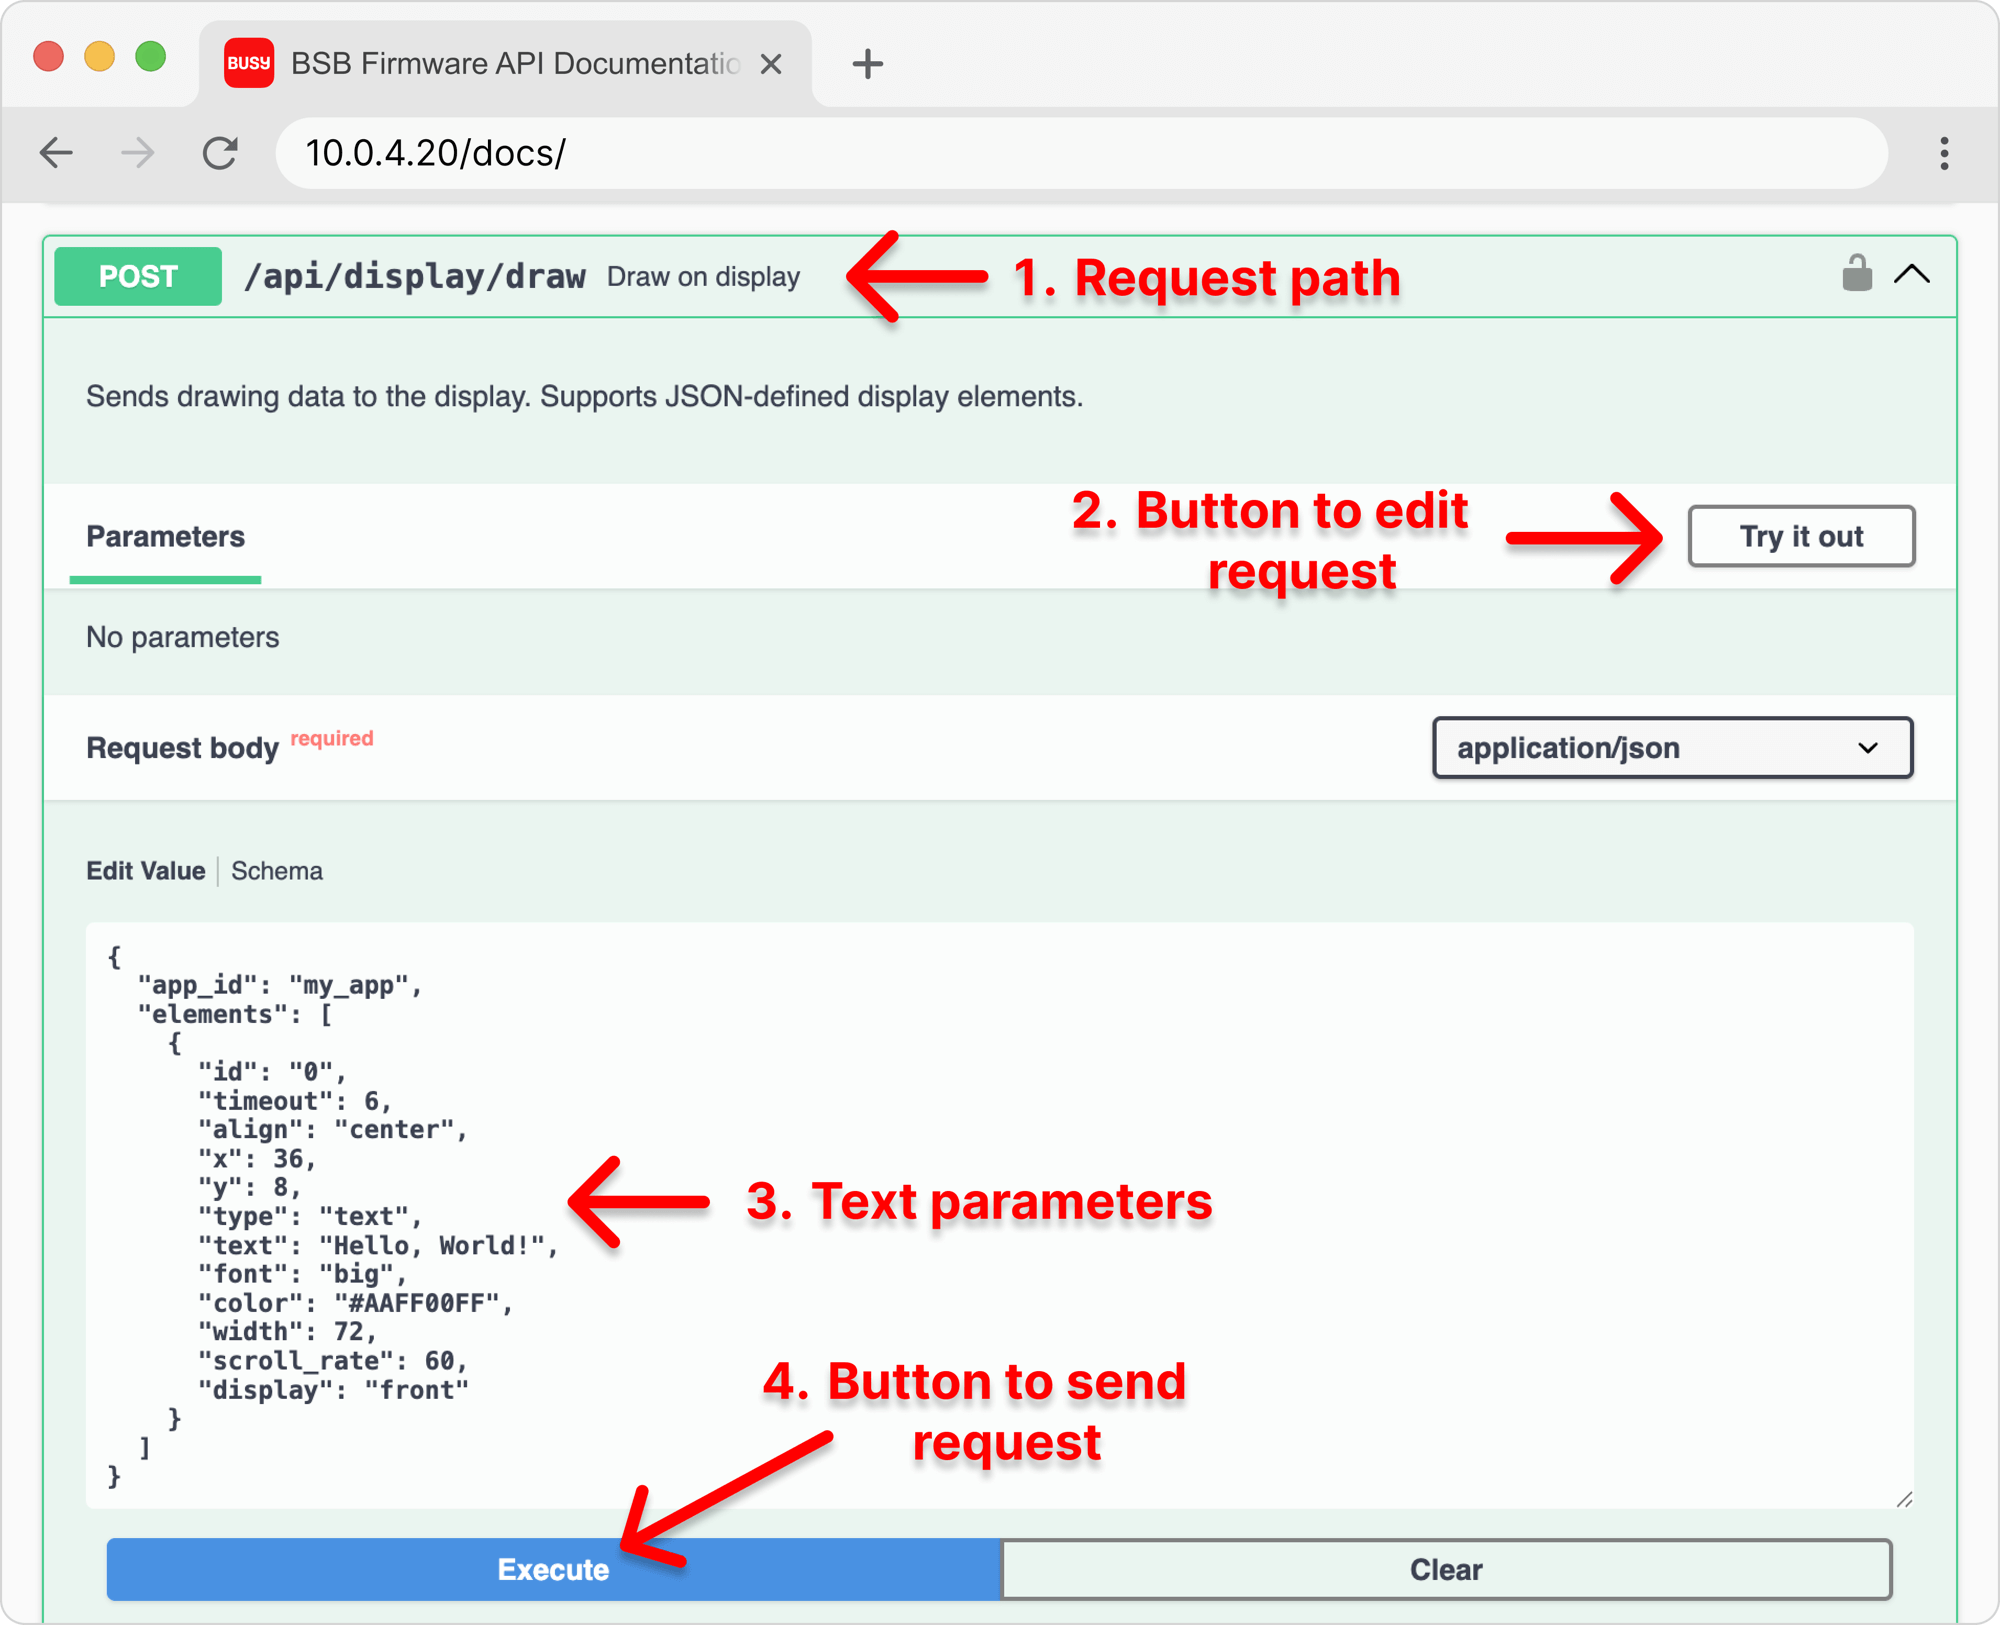
After you click Execute, the browser sends an HTTP API request to BUSY Bar, which returns a response indicating either successful execution (OK) or an error (Bad Request) if something is wrong with the request. In case of successfully executed request, BUSY Bar displays “HELLO, WORLD!”.
[Video] The results of a successfully executed request — BUSY Bar displays "HELLO, WORLD!" on its screen
How AI can help with using HTTP API
There are tons of guides, discussions, and code examples online for working with HTTP. But, AI assistants already know all of them, and can help you create BUSY Bar widgets — you don't need any programming skills.
To create a widget using an AI assistant (like ChatGPT, Gemini, Claude, and others), you need to:
- Explain how to display images and text on the screen (1 prompt)
- Explain what the widget should do (1-2 prompts)
- Ask the assistant to fix any issues (0-10 prompts)
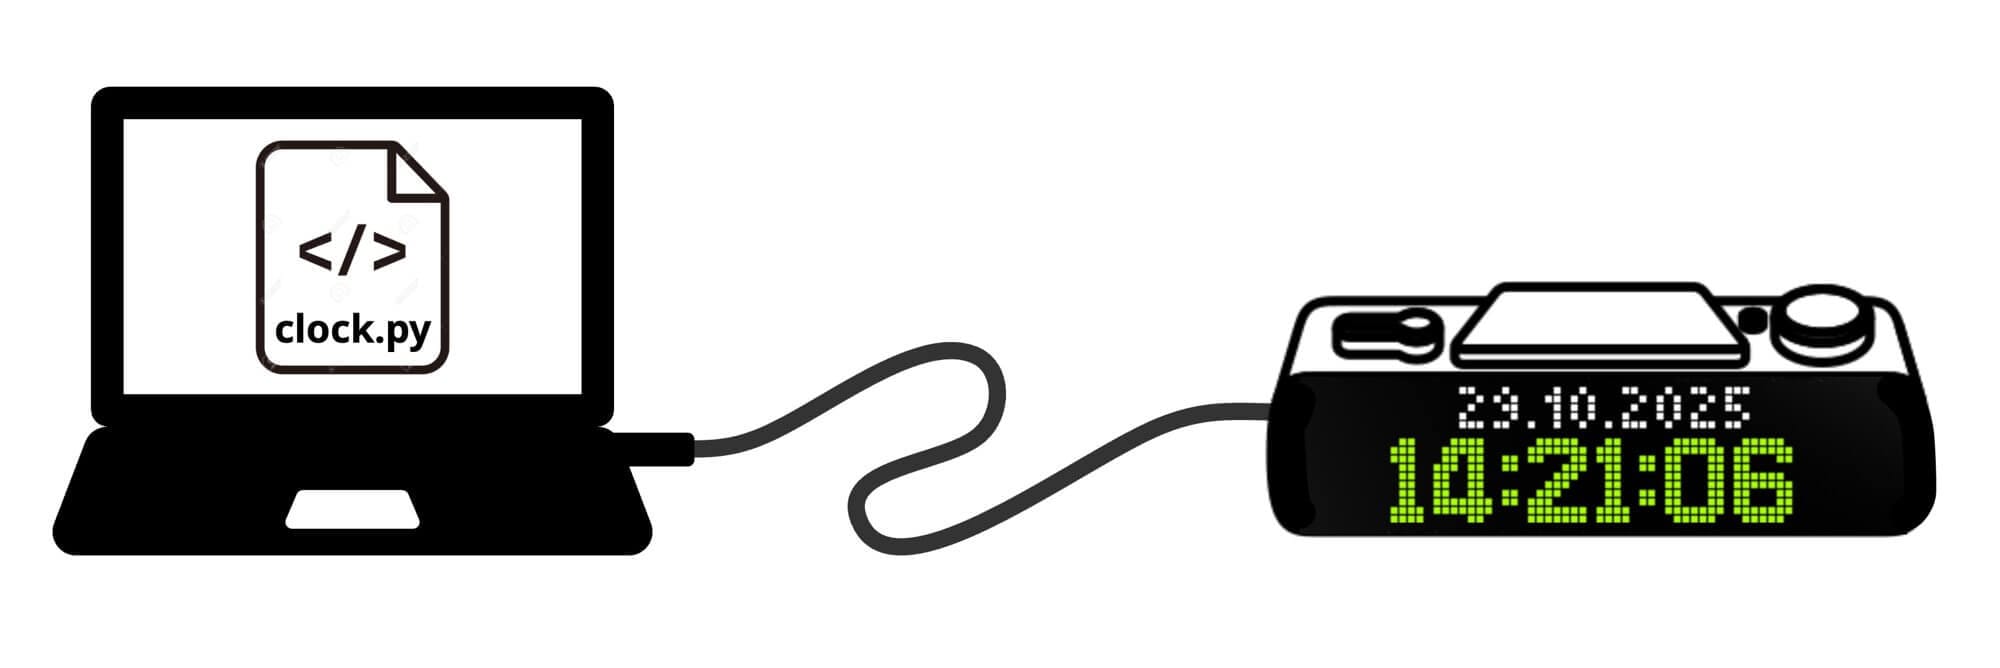
As a result, you’ll get a script that runs on your PC and sends the widget’s UI to a BUSY Bar connected via USB using the HTTP API.
Next, we’ll show some real, practical examples of how to create a widget without writing any code. We’ll be using ChatGPT. All of these AI-generated scripts are available via the links featured in each step.
Step 0: Teaching the AI to work with the BUSY Bar screen
Every time we begin to create a widget, we need to teach the AI how to use the BUSY Bar’s HTTP API — specifically these two requests:
/api/assets/upload— to upload images to BUSY Bar./api/display/draw— to display text and previously uploaded images.
AI prompt (based on the HTTP API documentation):
I have a device with a 72x16 color LED screen and an HTTP API. The device IP address is 10.0.4.20. The HTTP API supports 2 POST requests:
/api/assets/upload - to upload an image to the device (Content-Type: application/octet-stream). The request has 2 parameters: app_id (text ID of the app) and file (file name).
/api/display/draw - to display text and previously uploaded images. There are 3 fonts: small (height 5), medium (height 7) and big (height 10). The width parameter sets the text field width (text will scroll at the scroll_rate speed if it doesn't fit). Example request:
{
  "app_id": "my_app",
  "elements": [
    {
      "id": "0",
      "timeout": 6,
      "type": "text",
      "text": "Hello, World!",
      "x": 1,
      "y": 3,
      "font": "big",
      "color": "#AAFF00FF",
      "width": 72,
      "scroll_rate": 60,
    },
    {
      "id": "1",
      "timeout": 6,
      "type": "image",
      "path": "data.png",
      "x": 0,
      "y": 0,
    }
  ]
}
Result: The AI can now display images and text on the BUSY Bar screen via USB, using different fonts and text colors.
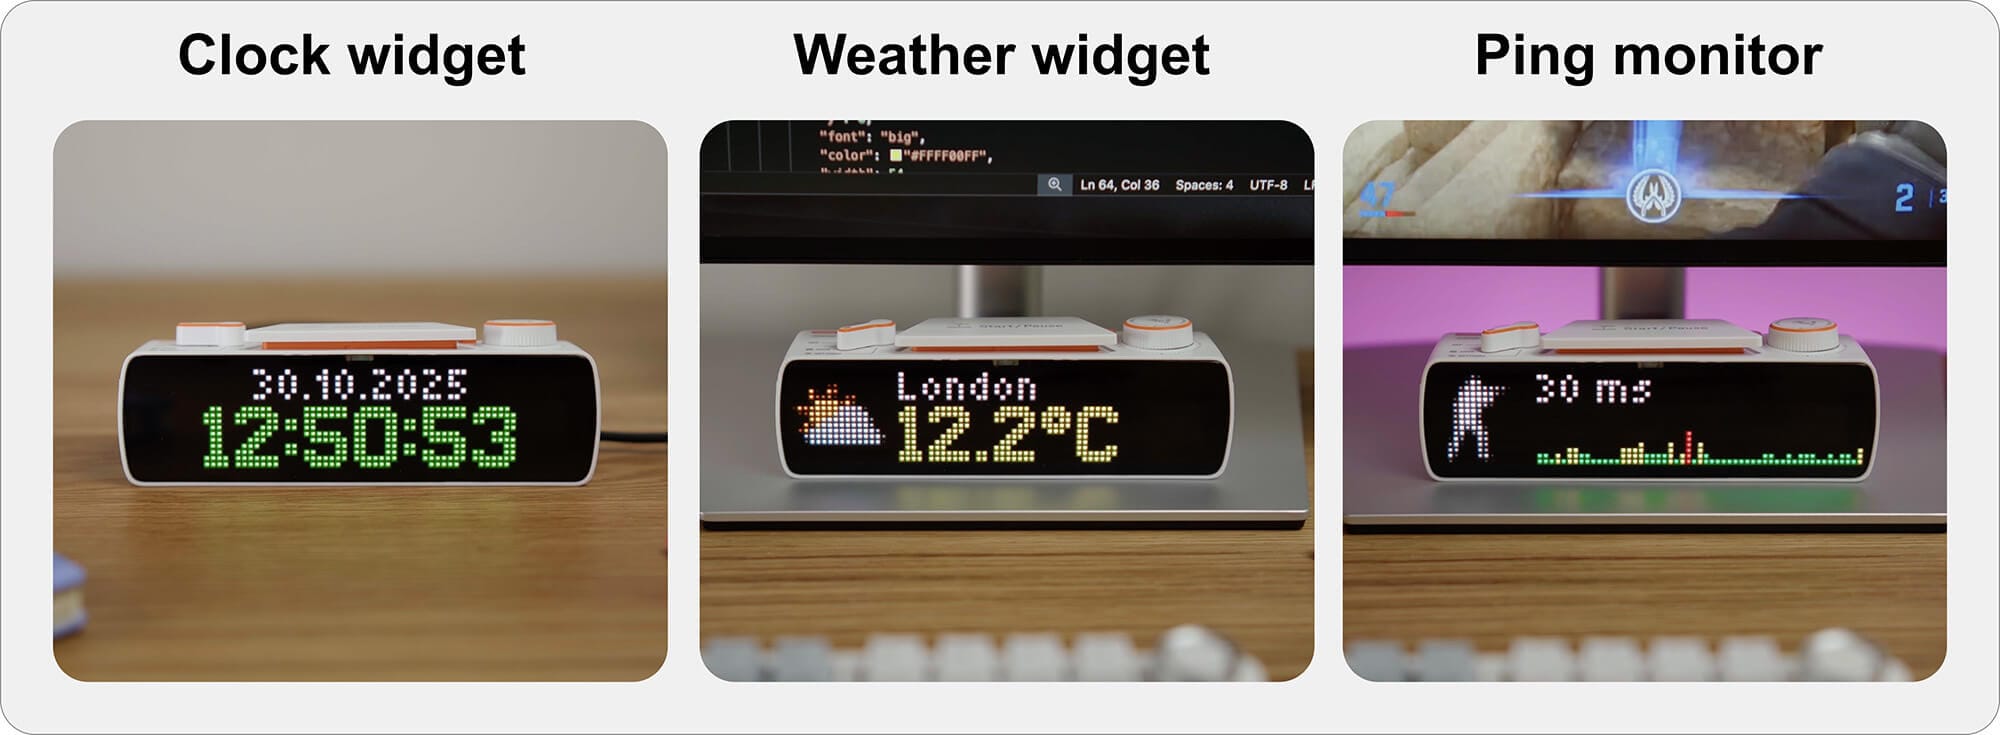
Creating a Clock Widget
To start, just for practice, let’s create a very simple widget — a clock with the date. The time and date will come from your PC and update on the BUSY Bar screen every second. We’ll display the time in a large font, since it’s usually more important to see the time than the date.
Step 1: Displaying time and date
Result: The AI wrote a Python script. Save it as a file with the .py extension and run it in the terminal using python file.py (Windows) or python3 file.py (Linux/macOS).
Downloadable script: clock-1.py
Not bad, but this is just a static image. Let’s ask the AI to make the clock run, fix the horizontal alignment, and add some colors.
Step 2: Running clock, colors, and alignment
Script: clock-2.py
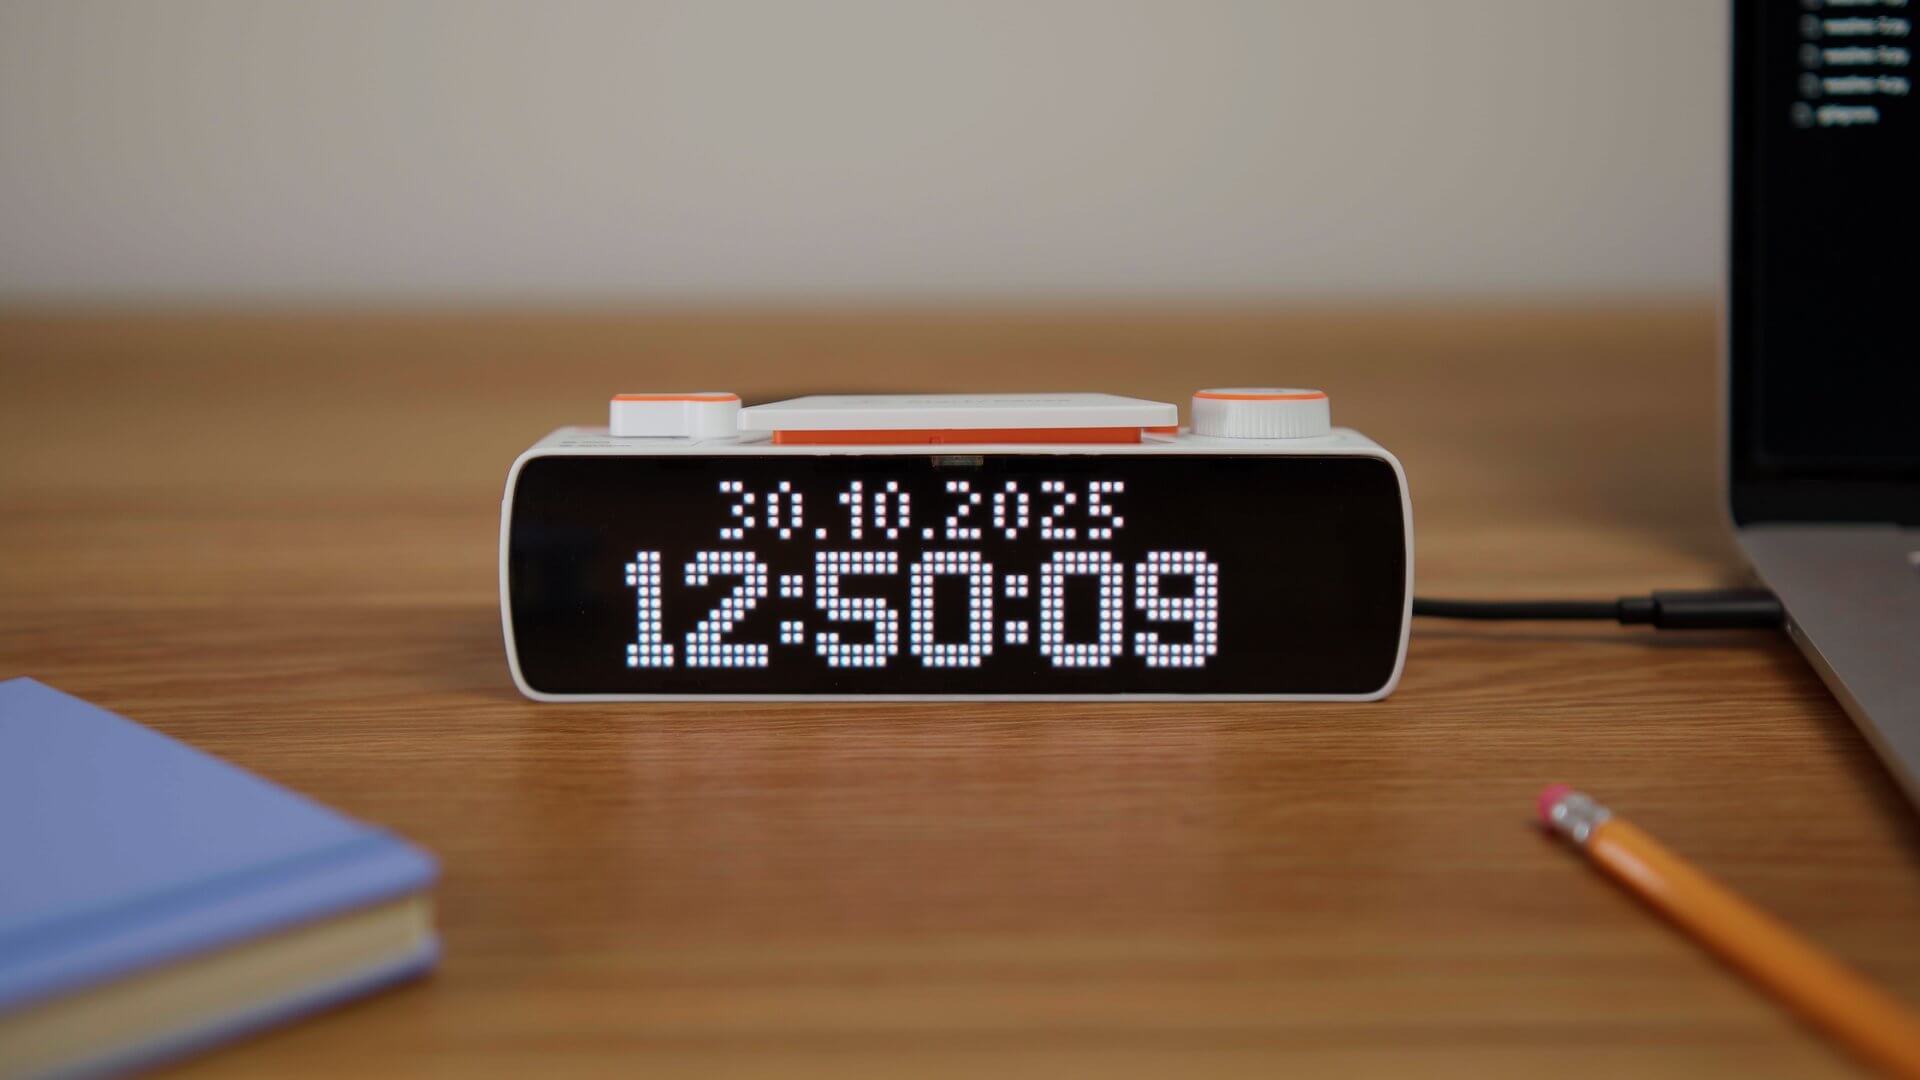
Result:
[Video] Clock Widget. Step 2: Completed widget
We managed to complete the widget in just three prompts. The only note is that the AI centers text with some inaccuracy, because different characters (such as the digits 1 and 5) have different widths. In the next version of the HTTP API, we will add text alignment both horizontally and vertically, which will fully solve this issue.
Creating a Weather Widget
The script running on a PC retrieves weather data from public online sources and displays it on the BUSY Bar screen for multiple cities. For each city, the weather icon, city name, and temperature are shown.
Step 1: Displaying the weather
Script: weather-1.py
Result:
[Video] Weather Widget. Step 1: Displaying the weather for three cities
It’s clear that the script is successfully retrieving weather data, but because of the fast text scrolling and frequent city changes, it’s impossible to read anything right now. Let’s fix this.
Step 2: Improving the interface
Script: weather-2.py
Result:
[Video] Weather Widget. Step 2: New layout of elements on the screen
We’ve made good progress, but there are still a couple of minor issues. Let’s fix them with the next AI prompts.
Step 3: Dealing with the degree symbol
Script: weather-3.py
Result:
[Video] Weather Widget. Step 3: The degree symbol now displays correctly
Almost there. The only issue is those strange weather icons. It seems a weak point for ChatGPT, so why not use weather icons from emojis instead?
Step 4: Adding nice icons
We need to prepare icons for the main weather conditions (sunny, cloudy, rain, etc.). We can get these icons from public sources, like Google’s Noto Color Emoji 16.0 font. Images of all the symbols are available in the repository on GitHub.
We’ll need the following images:
- ☀️
sun.png— symbol u2600 - ☁️
cloud.png— symbol u2601 - 🌫️
fog.png— symbol u1f32b - ⛅
partly.png— symbol u1324 - 🌧️
rain.png— symbol u1327 - 🌨️
snow.png— symbol u1328
These images need to be resized to 16×16 and saved in an icons folder, which needs to be placed in the folder with the script. After that, let's ask the AI to update the script.
icons folder: cloud.png, fog.png, partly.png, rain.png, snow.png, sun.png.Script: weather-4.py
Result:
[Video] Weather Widget. Step 4: Completed widget
🚀 Done! You can modify the list of cities in the script. If you keep only one city, the widget will just display its weather, updating every 3 seconds.
Creating a Ping Monitor
Ping is a way to check the availability of devices on a network. It works by sending a special request to the IP address of the target device and measuring the time it takes to get a response.
This parameter is important in some online games, where the game’s outcome can depend on the server’s reaction speed and connection quality. That’s why having a real-time ping indicator is useful.

Step 1: Displaying the ping chart
Script: ping-monitor-1.py
The AI generated a script that takes the server’s and BUSY Bar's IP addresses as parameters. This means you need to specify the addresses when running the script. For example, if the server’s address is 8.8.8.8, the command to monitor its availability would look like this:python3 ping-monitor-1.py --server 10.0.4.20 --target 8.8.8.8
Result:
[Video] Ping Monitor. Step 1: Displaying the chart and the current ping value on the screen
Great, it’s almost ready. But it’s not clear exactly which values we’re seeing on the chart. And that’s not really important. What matters is that you can immediately see deviations from normal ping values. We can use different colors to indicate good, average, and poor ping.
Step 2: Coloring the chart
Script: ping-monitor-2.py
Result:
[Video] Ping Monitor. Step 2: The chart is colored according to the ping value
Great! There’s just one small, cosmetic detail left — showing the game logo on the left side of the screen.
Step 3: Adding the game logo
csgo.png, 16×16) to the left of the chart. Move the chart and the ping value so that they don’t overlap the logo.The AI requires the logo to be in the same folder as the script. Let’s find a suitable image online, resize it to 16×16, and save it.
Script: ping-monitor-3.py
Result:
[Video] Ping Monitor. Step 3: Completed widget
🚀 Done! In just a few steps and without writing any code, we were able to create a useful widget. It can be used not only to monitor the availability of a game server but also to keep track of any other servers on your LAN or the internet.
Kickstarter is coming
In early 2026 we’ll launch our Kickstarter campaign. Pre-order in our shop to get access to the Early Bird Offer price when the campaign launches:

Don’t forget to visit the project website at busy.bar and try out BUSY App — available now!